


The US growth outlook is less robust than forecasts suggest
Article information and share options
This article was written
By
Forecasts for the US economy's growth this year are being raised, including ours to 2.2%, yet the insurance sector may not feel a benefit. The rise largely reflects "carry-over effects", where prior year growth dynamics affect current-year forecasts. The US has a large 1.3% carry-over into this year after it grew by 3.3% annualised in the last quarter of 2023. This mechanically lifts our headline forecast, but masks the slowdown we still expect. A mix of slowing consumer and corporate demand, limited monetary easing and asset price volatility may challenge insurers. Other regions see smaller carry-over effects.
- Our significant upward revision to US real GDP growth to 2.2% for 2024 is largely driven by above-average carry-over effects due to upside surprises to end-2023 US economic activity.
- The US economic outlook is less robust than the headline forecast suggests. We still see a slowdown with four quarters of below-trend growth ahead.
- The same carry-over distortions are not present for the euro area. Our unchanged 2024 forecast of 0.3% real GDP growth indicates the still weak underlying growth backdrop we expect this year.
- The persistent economic momentum responsible for the strong carry-over effects contributes to our expectation of limited policy easing in the US this year. Insurers may continue to benefit from still elevated interest rates.
This month has seen a wave of upward revisions to US GDP growth forecasts, including our own, after much stronger-than-expected 3.3% growth in the final quarter of 2023.1 We raised our 2024 US growth forecast significantly to 2.2% from 1.1% previously (all in real terms). It is important that insurance companies recognise this mechanical uplift and plan for US growth to soften relative to last year.
The uplift stems from a statistical phenomenon: the "carry-over effect", in which the current year's growth rate is influenced by the growth dynamics in the four quarters of the last year. The outsized 4Q23 US GDP growth rate created a large carry-over effect in 2024, but we still expect a sequential slowdown in quarterly growth rates this year. This is likely to create an uncomfortable combination of tighter-for-longer monetary policy given the residual US economic resilience, stress in certain insurance lines of business from waning consumer demand and rising business insolvencies, and market volatility as the timeline for interest rate cuts evolves.
The carry-over effect is generated because real GDP growth is forecast as the year-on-year change in average real GDP level of the four quarters of the year. This means the rate is determined by growth dynamics in the four quarters of the prior year, as well as those in the current year, as illustrated in Figure 1.
Figure 1. Illustration of carry-over effects from year 1 to year 2, which can be either positive (top) or negative (bottom)
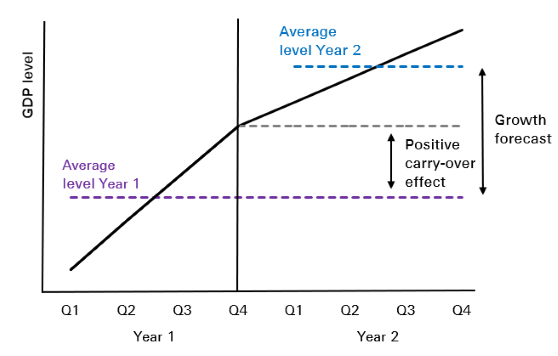
Figure 1. Illustration of carry-over effects from year 1 to year 2, which can be either positive (top) or negative (bottom)
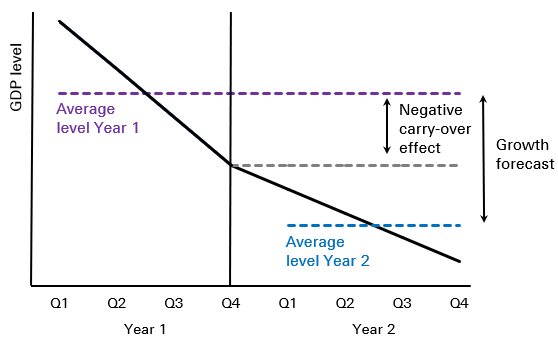
The carry-over effect can be understood as what real GDP growth would be this year if all quarterly growth rates in 2024 were zero (ie, the quarterly GDP level remains unchanged from 4Q 2023).2 This statistical "overhang" also holds for our inflation forecasts calculated based on monthly prints.3 It is worth noting that reporting GDP growth in this way is common convention, but not the only way. For example, the US Federal Reserve and Bank of England report year-on-year GDP growth rates, or the percentage change between the same quarter of subsequent years.
The fast pace of US real GDP growth in 4Q23 translates into a 1.3% carry-over into 2024 GDP growth. The effect is non-linear: this is almost double the effect on 2023 from 2022, and more than three times what is expected for 2025 (see Table 1). Weaker 4Q23 GDP growth would have created less carry-over: eg, at consensus forecast GDP growth of 2.0%, carry-over would have been only 1.1%.
Table 1. SRI forecasts for US and euro area real GDP growth, and estimated carry-over effects
The above-average carry-over effect in the US masks the slowdown in our outlook. Looking at the quarterly profile (SAAR) of our growth forecast shows how we expect growth to play out over 2024 (see Figure 2). We maintain our view that the US economy faces four quarters of below-trend growth (below 1.9%) in 2024, slowing in 1Q through to 3Q, before picking up to 1.4% in 4Q24. The reverse holds true in 2025. Our overall real GDP growth forecast of 1.9% for 2025 is 0.3 percentage points (ppts) lower than 2024, yet the weakest quarter of growth in our 2025 projections is 2.1%.
Figure 2. US and euro area real GDP growth profile (q-o-q seasonally adjusted annualised growth rate in %)
Figure 3. Carry-over effects in US and euro area real GDP growth (dotted lines denote forecasts)
In contrast, in Europe carry-over effects in 2024 have stalled to essentially zero given stagnant growth in 2023 (see Figure 3). This after carry-over growth from 2022 contributed 0.4ppts to full-year real GDP growth in the euro area last year. Our unchanged forecast of 0.3% for 2024 thus reflects the underlying growth weakness we still expect this year. In Europe, unlike the US, we expect a slight pick-up in sequential growth in 2024 from low levels amid recovering real wages.4
The big growth swings of the pandemic and recovery years led to abnormally high carry-over effects on growth in 2021 and 2022 (see Figure 3), of 2.4% and 2.1% respectively in the US, and in the euro area of 2.6% and 1.9%. Despite this year's above-average effect on the US, we expect waning effects from here, even as the ripple effects from the pandemic still influence and distort the macroeconomy in both regions.
We see three implications for the re/insurance and wider financial sectors. First, the persistent economic momentum responsible for the strong carry-overs in successive years contributes to our expectation of gradual and limited policy easing from the Fed in 2024. Insurers may benefit from robust investment returns as interest rates remain high. Second, economic data will likely be less resilient than the headline US forecasts as the slowdown unfolds this year, which may lead to financial market repricing and volatility as expectations for interest rate cuts evolve.
Third, for companies and consumers it will still feel like a slowdown,5 with interest rates high and inflation sticky. Rising corporate insolvencies, declining trade flows and weaker consumption could cause stress in certain insurance lines of business exposed to the economy, such as credit & surety.
references
References
1US Quarterly Economic Outlook, Swiss Re Institute, 7 February 2024. US GDP growth is reported as quarter-on-quarter, seasonally adjusted, annualised rates (SAAR).
2Beneath the surface: uncovering "true" growth and inflation, Swiss Re Institute, 5 September 2022.
3Carry-over effects are always present and mostly positive as real GDP and the CPI index generally increase.
4Europe quarterly economic outlook, Swiss Re Institute, 7 February 2024.
5Why Americans are so down on a strong economy, Wall Street Journal, 7 February 2024.
Tags
Contact: Get in touch with our experts

Swiss Re Institute
We share our risk knowledge in re/insurance through our publications, data sets, client programmes and conferences.